Stock Market Widgets for WordPress By Jika.io
| Author: | jika.io (profile at wordpress.org) |
| WordPress version required: | 6.4 |
| WordPress version tested: | 6.4.3 |
| Plugin version: | 1.0.0 |
| Added to WordPress repository: | 28-03-2024 |
| Last updated: | 28-03-2024 |
| Rating, %: | 100 |
| Rated by: | 1 |
| Plugin URI: | https://www.jika.io/widgets |
| Total downloads: | 78 |
 Click to start download |
|
Jika.io Stock Market Widgets
The Jika.io Stock Market Widgets WordPress plugin enables seamless integration of stock widgets from Jika.io into your WordPress site using Gutenberg blocks, Elementor widgets, and shortcodes.
With the Jika.io Stock Market Widgets plugin, enhancing your WordPress website with dynamic stock information has never been easier. If you need any help or have questions, feel free to reach out for support.
Available Widgets
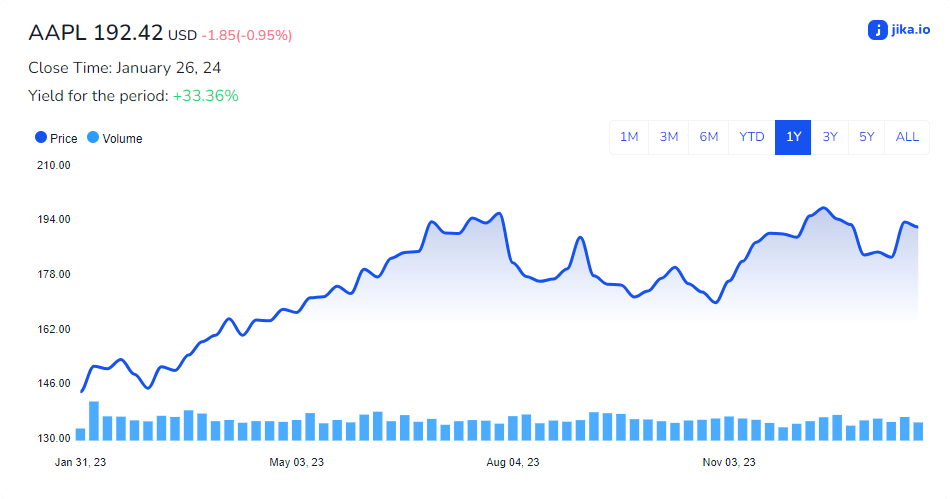
1. Real Time Stock Price Chart
With our stock ticker widget, you can easily display real-time stock prices and updates on your website or blog. Simply choose the stock you want to track and customize the widget to match your content.
Options:
symbol (default=”AAPL”): The symbol of the stock.
selection (default=”one_year”): Time period for the data.
- “one_month”
- “three_month”
- “six_month”
- “ytd”
- “one_year”
- “three_year”
- “five_year”
- “all”
close_key (default=”close”): Key for close price data.
- “close”
- “adjClose”
symbol_logo (URL, optional): URL of the stock symbol logo.
graph_color (default=#1652F0): Color of the graph.
background_color (default=#FFFFFF): Background color of the widget.
font-family (default=”Nunito”): Font family for the widget text.
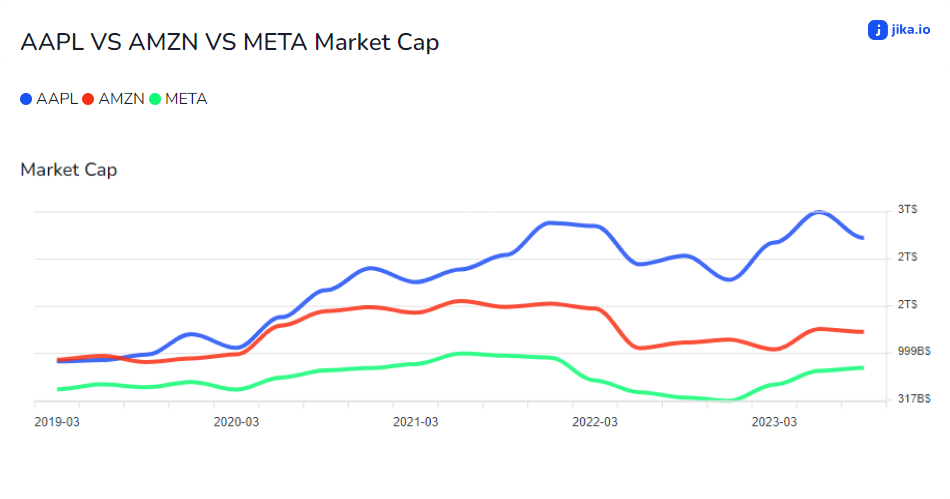
2. Advanced Stock Comparison Graph
Our stock comparison charts allow you to compare any metric for multiple stocks side by side. With our easy-to-use chart builder, you can select the stocks and metrics you want to compare. Whether you’re comparing stocks from the same industry or across different sectors, our charts provide a comprehensive view of stock performance.
Options:
symbols (default=”AAPL,AMZN”): Comma-separated list of stock symbols.
keys (default=”Market Cap,Net Income”): Comma-separated list of financial metrics to display.
reporting_period (default=”quarter”): Reporting period for the financial metrics.
- “quarter”
- “annual”.
from (default=current year): Start year for the financial data.
to (default=current year – 5): End year for the financial data.
text_color (default=”#161C2D”): Color of the text.
background_color (default=”#FFFFFF”): Background color of the widget.
font-family (default=”Nunito”): Font family for the widget text.
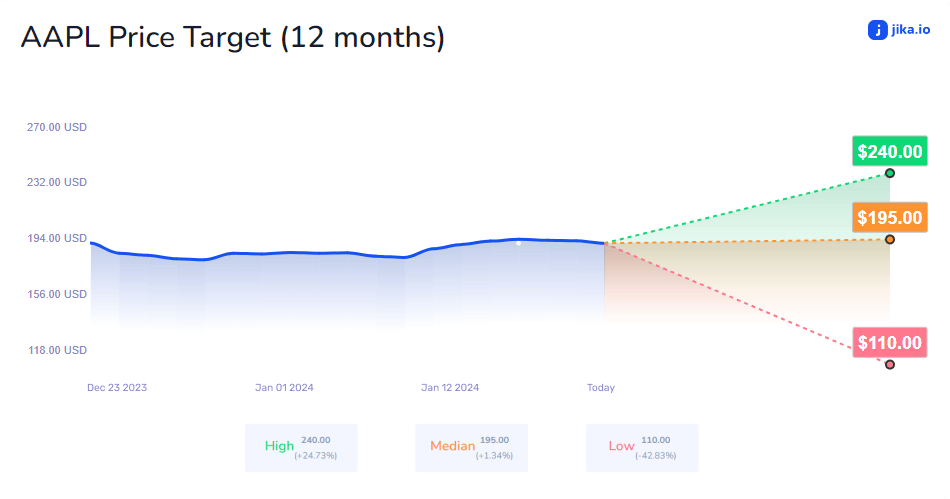
3. Stock Prediction and Forecast Widget
Our stock predictions and forecasts widget is using the most updated analysts rating data to provide predictions for stock prices. By embedding our widgets on your site, you can provide your audience with valuable insights into the stock market and help them make informed investment decisions.
Options:
symbol (default=”AAPL”): The symbol of the stock.
graph_color (default=#1652F0): Color of the graph.
background_color (default=”#FFFFFF”): Background color of the widget.
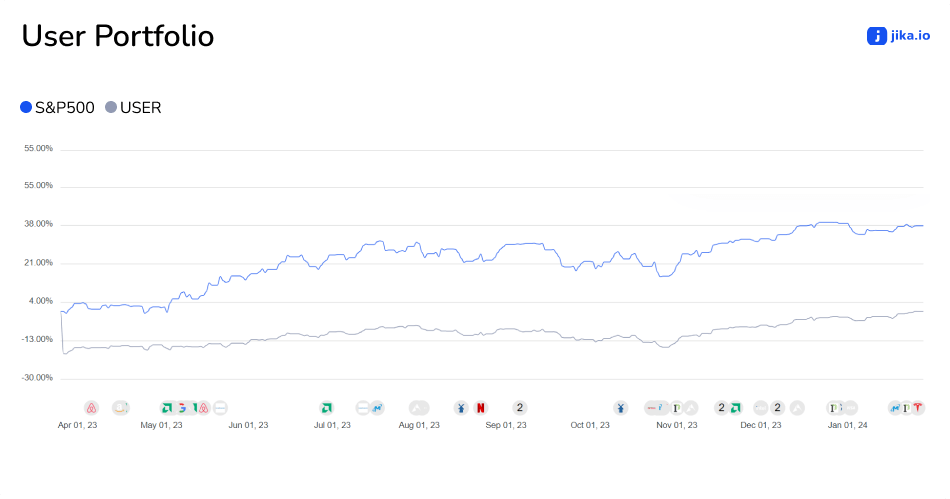
4. Stock Portfolio Performance Chart
With our stock portfolio widgets, you can easily share and embed your investment portfolio on your website, substack, notion dashboard or blog. Our widgets update in real-time, so your audience can see the latest changes to your portfolio as they happen. You will first need an account in Jika.io with a connected portfolio in order to use this widget.
Options:
user_name (default=”Noah Sebastian”): Your Jika.io username.
background_color (default=”#FFFFFF”): Background color of the widget.
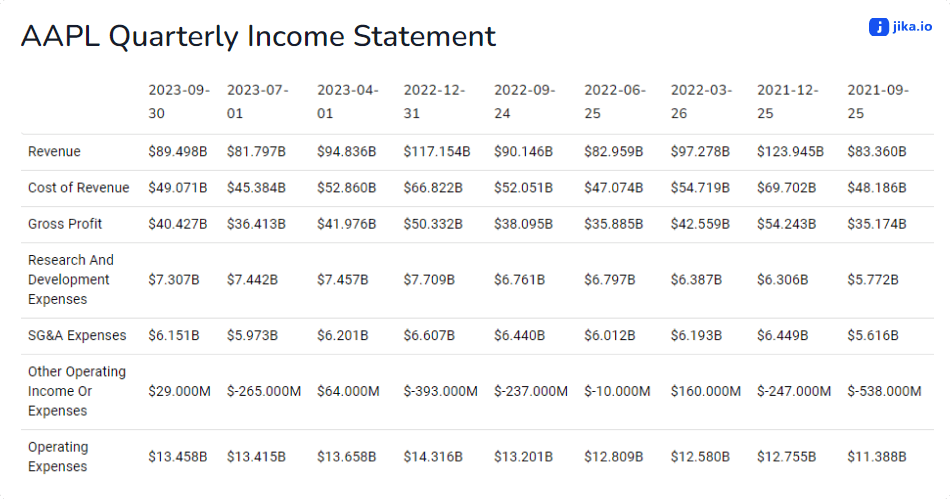
5. Company Financial Metrics Table
Our balance sheet widgets allow you to embed the financial data of a company onto your website or blog. This data includes key financial metrics such as assets, liabilities, and shareholder equity, providing your audience with valuable insights into a company’s financial health.
Options:
symbols (default=”AAPL,AMZN”): Comma-separated list of stock symbols.
keys (default=”Market Cap,Net Income”): Comma-separated list of financial metrics to display.
reporting_period (default=”quarter”): Reporting period for the financial metrics.
- “quarter”
- “annual”.
from (default=current year): Start year for the financial data.
to (default=current year – 5): End year for the financial data.
sort_method (default=”years”): Sorting method for the table.
- “years”
- “companies”
text_color (default=”#161C2D”): Color of the text.
background_color (default=”#FFFFFF”): Background color of the widget.
font-family (default=”Nunito”): Font family for the widget text.
Shortcode Examples
To embed these stock widgets using shortcodes, use the shortcode jika_stock_widget followed by the appropriate type and options.
Real Time Stock Price Chart
[jika_stock_widget type="real-time-stock-price-chart" symbol="AAPL" selection="one_year" close_key="close" symbol_logo="https://example.com/aapl_logo.png" graph_color="#ff0000" background_color="#ffffff" font_family="Arial"]
Advanced Stock Comparison Graph
[jika_stock_widget type="advanced-stock-comparison-graph" symbols="AAPL,AMZN" keys="Market Cap,Net Income" reporting_period="quarter" from="2020" to="2022" text_color="#000000" background_color="#ffffff" font_family="Arial"]
Stock Prediction and Forecast Widget
[jika_stock_widget type="stock-prediction-and-forecast" symbol="AAPL" graph_color="#ff0000" background_color="#ffffff"]
Stock Portfolio Performance Chart
[jika_stock_widget type="stock-portfolio-performance-chart" user_name="your_username" background_color="#ffffff"]
Company Financial Metrics Table
[jika_stock_widget type="company-financial-metrics-table" symbols="AAPL,AMZN" keys="Market Cap,Net Income" reporting_period="quarter" from="2020" to="2022" sort_method="years" text_color="#000000" background_color="#ffffff" font_family="Arial"]
Contributors & Developers
Welcome, developers! This section provides a quick guide to get started with our project.
Setting Up Environment Variables
To begin working on our project, follow these simple steps:
-
Create a new file named
.envin the root directory of the project. -
Add the following content to the
.envfile:ENV=development
-
Save the
.envfile.
That’s it!
You’ve successfully configured the development environment, and the plugin is now operating in sandbox mode, simplifying the development process.
Other Notes
-
Sandbox users will remain cached for one hour after their most recent activity.
-
Domains using 127.0.0.1 | localhost might face unexpected iframe usage issues due to conflicts.
3rd Party and external services
This plugin relies on external services to enhance its functionality and provide users with an optimal experience. We are committed to transparency regarding the integration of these services within our plugin. Below are the details of the external services utilized:
1. jika.io API:
- Description: Our plugin integrates with our API to manage user data efficiently and securely. This API facilitates various functionalities within the plugin, including login / signup / usage control.
- Service URL: jika.io API
- Terms of Use: Please refer to the jika.io API’s Terms of Use.
- Privacy Policy: For information regarding data handling and privacy practices, please review the Privacy Policy of jika.io.
2. PayPal JavaScript SDK:
- Description: To enable seamless payment processing, our plugin utilizes the PayPal JavaScript SDK. This SDK allows us to securely collect payments from users through PayPal.
- Service URL: PayPal JavaScript SDK
- Terms of Use: Please review PayPal’s Terms of Use.
- Privacy Policy: For information regarding data handling and privacy practices, please review PayPal’s Privacy Policy.
We prioritize user trust and data protection. Therefore, we have provided comprehensive documentation to ensure transparency regarding the use of external services. Users can review the terms of use and privacy policies associated with these services to make informed decisions about their data.
For any further inquiries or concerns regarding external service dependencies, please contact our support team at info@jika.io.
Reference
Font Family
NunitoArialHelveticaTimes New RomanTimesCourier NewCourierVerdanaRobotoOpen SansLatoMontserratPoppins
Financial keys
Key Metrics
Revenue Per ShareNet Income Per ShareOperating Cash-Flow Per ShareFree Cash-Flow Per ShareCash Per ShareBook Value Per ShareTangible Book Value Per ShareShareholders Equity Per ShareInterest Debt Per ShareEarnings YieldFree Cash-Flow YieldDays Of Sales OutstandingDays Of Payables OutstandingDays Of Inventory On HandCapex Per ShareMarket Cap
Income Statement
RevenueCost of RevenueGross ProfitOperating ExpensesResearch And Development ExpensesSG&A ExpensesSelling And Marketing ExpensesOther Operating Income Or ExpensesInterest ExpenseDepreciation And AmortizationEBITDAOperating IncomeTotal Non-Operating Income or ExpensePre-Tax IncomeIncome TaxesNet IncomeEPS - Earnings Per ShareEPS DilutedWeighted Average Shares vs. Shares OutstandingWeighted Average Shares vs. Shares Outstanding Diluted
Balance Sheet
Cash And Cash EquivalentsShort Term InvestmentsReceivablesInventoryOther Current AssetsTotal Current AssetsProperty, Plant And EquipmentGoodwill And Intangible AssetsLong-Term investmentsTax AssetsOther Non-Current AssetsTotal Non-Current AssetsOther AssetsTotal AssetsAccount PayablesShort Term DebtTax PayablesDeferred RevenueOther Current LiabilitiesTotal Current LiabilitiesLong Term DebtDeferred Revenue Non CurrentDeferred Tax Liabilities Non CurrentOther Non-Current LiabilitiesTotal Long Term LiabilitiesOther LiabilitiesTotal LiabilitiesCommon Stock NetRetained Earnings (Accumulated Deficit)Comprehensive IncomeOther Share Holders EquityShare Holder EquityTotal Liabilities and Share Holders EquityTotal InvestmentsTotal DebtNet Debt
Ratios
Current RatioQuick RatioCash RatioGross Profit MarginOperating Profit MarginPre-Tax Profit MarginNet Profit MarginEffective Tax RateReturn On AssetsReturn On EquityReturn On Capital EmployedDebt RatioDebt To Equity RatioLong-Term Debt To CapitalizationTotal Debt To CapitalizationInterest CoverageCash-Flow To Debt RatioReceivables TurnoverPayables TurnoverInventory TurnoverFixed Asset TurnoverAsset TurnoverPayout RatioOperating Cash-Flow To Sales RatioFree Cash-Flow To Operating Cash-Flow RatioCash-Flow Coverage RatiosShort-Term Coverage RatiosCapital Expenditure Coverage RatioDividend Paid And Capex Coverage RatioDividend Payout RatioPrice To Book RatioPrice To Sales RatioPE RatioPrice To Free Cash-Flows RatioPrice To Cash-Flow RatioPEG Ratio
Financial Growth
Revenue GrowthGross Profit GrowthEBIT GrowthOperating Income GrowthNet Income GrowthEPS GrowthEPS Diluted GrowthWeighted Average Shares GrowthWeighted Average Shares Diluted GrowthDividends Per Share GrowthOperating Cash-Flow GrowthFree Cash-Flow Growth10-Year Revenue Growth Per Share5-Year Revenue Growth Per Share3-Year Revenue Growth Per Share10-Year Operating Cash-Flow Growth Per Share5-Year Operating Cash-Flow Growth Per Share3-Year Operating Cash-Flow Growth Per Share10-Year Net Income Growth Per Share5-Year Net Income Growth Per Share3-Year Net Income Growth Per Share10-Year Shareholders Equity Growth Per Share5-Year Shareholders Equity Growth Per Share3-Year Shareholders Equity Growth Per Share10-Year Dividend Growth Per Share5-Year Dividend Growth Per Share3-Year Dividend Growth Per ShareReceivables GrowthInventory GrowthAsset GrowthBook Value Per Share GrowthDebt GrowthR&D Expense GrowthSG&A Expenses Growth
Cash Flow Statement
Net Income or LossDepreciation And AmortizationDeferred Income TaxStock-Based CompensationChange In Working CapitalOther Non-Cash ItemsChange In Accounts ReceivableChange In InventoriesChange In Accounts PayableOther Working CapitalCash Flow From Operating ActivitiesNet Change In Property, Plant And EquipmentNet Acquisitions or DivestituresPurchase Of InvestmentsSales or Maturities Of InvestmentsInvesting Activities - OtherCash Flow From Investing ActivitiesDebt RepaymentNet Common Equity IssuedNet Common Equity RepurchasedTotal Common And Preferred Stock Dividends PaidFinancial Activities - OtherCash Flow From Financial ActivitiesEffect Of Forex Changes On CashNet Cash FlowCash At Beginning Of PeriodCash At End Of PeriodOperating Cash FlowCapital ExpenditureFree Cash Flow
Screenshots
ChangeLog