
A WordPress plugin for displaying historical stock market live charts and technical indicators.
Stockdio Historical Chart contains a plugin and a widget that provide the means to display a live chart with intraday and historical prices and information for stock, index, currencies or commodities. Over 65 different stock exchanges and a large number of market indices, currencies and commodities are supported.
If you’re using the standard Gutenberg editor, the easiest way to include this plugin on your page is using the Historical Chart block, which is included in the Stockdio Financial Visualizations category.
If you’re using a different editor o prefer to use the shortcode, below is a sample to help you start. Please be aware that most of the parameters listed below are optional, and are also available through the plugin’s settings page. Any parameter you include in the shortcode will overwrite the parameter used in the settings page.
[stockdio-historical-chart symbol="AAPL" stockExchange="NYSENasdaq" width="580" height="380" motif="financial" palette="financial-light"]
This plugin is part of the Stockdio Financial Widgets, which also includes the following plugins:
The following parameters are supported in the shortcode and also available through the plugin’s settings page:
stockExchange: The exchange market the symbol is a member of (optional). If not specified, NYSE/NASDAQ will be used by default. For a list of available exchanges please visit www.stockdio.com/exchanges.
symbol: The company’s stock symbol (ex. AAPL), market index ticker (ex. ^SPX), currency pair (ex. EUR/USD) or commodity ticker (ex. GC). For a list of available market indices please visit www.stockdio.com/indices. For available currencies please visit www.stockdio.com/currencies and for available commodities, please go to www.stockdio.com/commodities.
compare: Specify a list of valid stock symbols or market indices against which to compare the base symbol, separated by semicolon (ex. MSFT;GOOG;^SPX;^IXIC). Not case sensitive (optional).
height: Height of the chart in either px or % (default: 320px).
width: Width of the chart in either px or % ( default: 100%).
displayPrices: Allows to specify how to display the prices on the chart, using one of the following options (default: Line):
- Line
- Candlestick
- Area
- OHLC
- HLC
includeVolume: Allows to display or hide the volume on the chart. By default, volume is visible. Use includeVolume=false to hide it (optional).
performance: If enabled (true), price performance (percent change) will be displayed, instead of actual price.
culture: Allows to specify a combination of language and country settings, used to display texts and to format numbers and dates (e.g. Spanish-Spain). For a list of available culture combinations please visit http://www.stockdio.com/cultures.
intraday: If enabled (true), intraday delayed data will be used if available for the exchange and number of days is between 1 and 5. For a list of exchanges with intraday data available, please visit www.stockdio.com/exchanges.
days: Allows to specify the number of days for the period to display. Used only if the start and/or the end date are not specified. If not specified, its default value is 365 days. If intraday data is available for the stock exchange and the exchange is currently open, the default number of days is 1.
allowPeriodChange: If enabled (true), it provides a UI to allow the end user to select the period for the data to be displayed. This UI is only available if the from and to parameters have not been specified. This UI is enabled by default.
from: From date. If not specified, the “from” date will be the “to” date minus the number of days specified in the days parameter.
to: To date. If not specified, the “to” date will be today’s date.
motif: Design used to display the visualization with specific aesthetics, including borders and styles, among other elements. (optional). For a list of available motifs please visit www.stockdio.com/motifs.
palette: Includes a set of consistent colors used for the visualization. (optional). For a list of available palettes please visit www.stockdio.com/palettes.
font: Allows to specify the font that will be used to render the chart. Multiple fonts may be specified separated by comma, e.g. Lato,Helvetica,Arial.
loadDataWhenVisible: Allows to fetch the data and display the visualization only when it becomes visible on the page, in order to avoid using calls (requests) when they are not needed. This is particularly useful when the visualization is not visible on the page by default, but it becomes visible as result of a user interaction (e.g. clicking on an element, etc.). It is also useful when using the same visualization multiple times on a page for different devices (e.g. using one instance of the plugin for mobile and another one for desktop). We recommend not using this by default but only on scenarios as those described above, as it may provide the end user with a small delay to display the visualization (optional).
Screenshots

Example of live stock chart using Financial motif in English-US, displaying prices as Line.

Example of live stock chart with Prices Comparison.

Example of live stock chart with Price Performance.

Example of live stock chart displaying Currencies prices.

Example of live stock chart using Material motif and High-contrast palette in Spanish-Spain, displaying prices as Area.

Example of small live stock chart using Healthy motif and Mesa palette in Simplified Chinese, displaying prices as Candlestick.

Example of live stock chart using Lizard motif and Whitespace palette in German, displaying prices as OHLC.

Example of live stock chart using Blinds motif and Mint-Choc palette in Portuguese-Brasil, displaying prices as Line.

Example of live stock chart using Block motif and Modern-Business palette in Dutch, displaying prices as Candlestick.
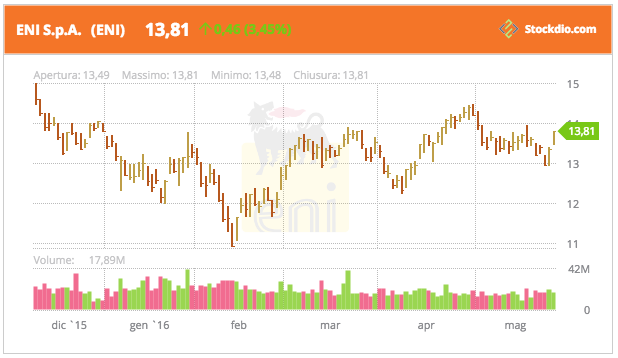
Example of live stock chart using Tree motif and Healthy palette in Italian, displaying prices as HLC.

Example of live stock chart using Aurora motif and palette in Japanese, displaying prices as Line.
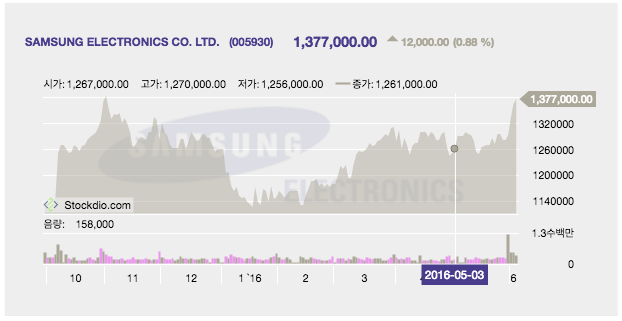
Example of live stock chart using Face motif and Lilacs-In-Mist palette in Korean, displaying prices as Area.

Example of live stock chart using Topbar motif and Excite-Bike palette in Russian, displaying prices as Candlestick.

Stockdio Stock Quotes List is also available as a complement to the Stockdio Historical Chart.

Stockdio Stock Market Overview is also available as a complement to the Stockdio Historical Chart.

Stockdio Stock Market News is also available as a complement to the Stockdio Historical Chart.

Stockdio Stock Market Ticker is also available as a complement to the Stockdio Historical Chart.

Settings page.

Stockdio toolbar integration with easy to use dialog.

Stock Prices Chart widget dialog.

Stock Prices Chart block as part of the Stockdio Financial Visualizations category.

Stock Prices Chart block sidebar settings.
How do I integrate the Stockdio Historical Chart in my page?
There are three options to integrate it: a. Using the Stock Prices Chart block, b. Using the short code, or c. Through the use of the widget in your sidebars.
How do I know if the Stock Exchange I need is supported by Stockdio?
Stockdio supports over 65 different world exchanges. For a list of all exchanges currently supported, please visit www.stockdio.com/exchanges. If the stock exchange you’re looking for is not in the list, please contact us to info@stockdio.com. Once you have found in the list the stock exchange you need, you must pass the corresponding Exchange Symbol using the stockExchange parameter.
How do I specify the symbol to display?
You can specify any symbol you want, from the selected exchange. If the symbol you want to display does not show up, you can go to http://finance.stockdio.com to verify if the symbol is currently available in Stockdio. If the symbol you require is missing, please contact us at info@stockdio.com.
Can I create a chart for a market index?
Yes, you can specify an index in the symbol parameter, using the ^ prefix. For example, use ^SPX for S&P 500 or ^DJI for the Dow Jones. For a complete list of indices currently supported, please visit www.stockdio.com/indices
Can I create a chart for a specific commodity?
Yes. You must use COMMODITIES as the stockExchange and then specify the commodity in the symbol parameter. For example, use GC for Gold. For a complete list of commodities currently supported by Stockdio, please visit www.stockdio.com/commodities
Can I create a chart for a particular currency?
Yes. You must use FOREX as the stockExchange and then specify the currency in the symbol parameter. For example, use EUR for Euro. For a complete list of currencies currently supported by Stockdio, please visit www.stockdio.com/currencies
Can I specify the numbers and dates format used in my country/region?
Yes, Stockdio supports a number of cultures, used to properly display numbers and dates. For a complete list of cultures currently supported by Stockdio, please visit www.stockdio.com/cultures.
Can I specify my own colors for the chart?
Yes, this plugin is provided with a number of predefined color palettes, for ease of use. For a complete list of color palettes currently supported by Stockdio, please visit www.stockdio.com/palettes. However, if you need specific color customization, you can use the Stock Prices Chart block, or use the Stockdio iframe available at http://services.stockdio.com, which supports more options.
The company logo for the symbol is not correct or updated, can this be fixed?
Sure! Simply contact us to info@stockdio.com with the correct or updated logo and we will update it, once it has been verified.
Can I place more than one chart plugin on the same page?
Yes. By default, all charts will use the values specified in the plugin settings page. However, any of these values can be overridden using the appropriate block or shortcode parameter. Each block or shortcode can be customized entirely independent.
How can I contact Stockdio if something is not working as expected?
Simply send an email to info@stockdio.com with your question and we will reply as soon as possible.
Can I create a chart for a specific cryptocurrency?
Yes. You must use CRYPTO as the stockExchange and then specify the cryptocurrency in the symbol parameter. For example, use BTC for Bitcoin. For a complete list of cryptocurrencies currently supported by Stockdio, please visit www.stockdio.com/cryptocurrencies
Can I create a chart for a specific future?
Yes. You must use FUTURES as the stockExchange and then specify the future in the symbol parameter. For example, use GCM19 for Oil Jan ’19. For a complete list of futures currently supported by Stockdio, please visit www.stockdio.com/futures
Can I create a chart for a specific bond?
Yes. You must use BONDS as the stockExchange and then specify the future in the symbol parameter. For example, use US10YBY for US 10-Year Bond Yield. For a complete list of bonds currently supported by Stockdio, please visit www.stockdio.com/bonds
ChangeLog
2.8.13
Release date: March 07, 2024
- Fixes vulnerability issue.
2.8.12
Release date: March 05, 2024
- Fixes vulnerability issue.
2.8.11
Release date: November 01, 2023
- Fixes vulnerability issue.
2.8.10
Release date: March 30, 2023
2.8.8
Release date: May 24, 2022
2.8.7
Release date: June 29, 2021
2.8.6
Release date: May 13, 2021
2.8.5
Release date: May 03, 2021
2.8.4
Release date: January 27, 2021
- Minor bug fixes to properly support compatibility with legacy versions of WordPress.
2.8.3
Release date: January 24, 2021
- Minor block bug fixes and enhancements.
2.8.2
Release date: January 19, 2021
- Minor block bug fixes and enhancements.
2.8.1
Release date: January 14, 2021
- Addition of wizard to easily support selection of symbols.
- Minor bug fixes and security enhancements.
2.7.2
Release date: June 19, 2020
Bug Fixes:
- Minor block bug fixes and enhancements.
2.7.1
Release date: June 18, 2020
- Addition of the Stock Prices Chart block for easy configuration in the standard Gutenberg editor.
2.6.16
Release date: May 7, 2020
- Change to support referrals on certain browsers.
2.6.15
Release date: April 02, 2020
- Support for new culture: Traditional Chinese
2.6.14
Release date: December 09, 2019
- Fixes issue with Load Data When Visible setting.
2.6.13
Release date: August 16, 2019
- Support for NEO Exchange (NEO).
2.6.12
Release date: January 31, 2019
- Support for Cryptocurrencies, Futures and Bonds.
- Fixes issue with deprecated functions.
2.6.11
Release date: October 24, 2018
- Fixes issue with ticker auto calculated height.
2.6.9
Release date: October 03, 2018
- Support for new cultures: Turkish, Arabic, Hebrew, Swedish, Danish, Finnish, Norwegian, Icelandic, Greek, Czech, Thai, Vietnamese, Hindi, Indonesian
2.6.8
Release date: June 05, 2018
New features:
- Support for ability load data only when the visualization becomes visible. Please refer to the documentation for details.
2.6.7
Release date: May 14, 2018
Bug Fixes:
- Fixes an issue with some parameters not being honored from the settings page.
2.6.5
Release date: May 14, 2018
- Fixes issue with deprecated functions.
2.6.3
Release date: Feb 26, 2018
- Support for feature that allows to display or hide the volume.
2.6.2
Release date: November 30, 2017
- Support for WordPress 4.9
2.6.1
Release date: June 21, 2017
Bug Fixes:
- Fixes an issue that prevented some properties from the settings page to be used.
2.6
Release date: June 12, 2017
- Support for BATS ETF (included in the NYSENasdaq stockExchange category).
2.5
Release date: May 25, 2017
- Support for Canadian Securities Exchange (CSE).
- Support for new language and culture: Polish-Poland.
2.4
Release date: May 16, 2017
- Stock Prices Chart Widget is now available along with the plugin, for even easier integration.
2.3
Release date: March 28, 2017
- Compatibility with new plugins Marketplace.
2.2
Release date: March 22, 2017
* Compatibility with new Stock Market Overview plugin.
2.1
Release date: February 24, 2017
- Support for new language and culture: Turkish-Turkey.
- Compatibility with new Stock Market Ticker plugin.
2.0
Release date: November 10, 2016
- Support for intraday delayed data, if available for the exchange. For a list of exchanges that support intraday data, visit www.stockdio.com/exchanges.
- Support for stocks comparison.
- Support for price performance display (percent change as opposed to price display).
- Support for Currencies (Forex) and Commodities prices.
1.3.10
Release date: October 13, 2016
Support for several additional stock exchanges and their corresponding indices:
- Johannesburg Stock Exchange (JSE)
- Irish Stock Exchange (ISE)
- Tadawul Saudi Stock Exchange (TADAWUL)
- Warsaw Stock Exchange (WSE)
- Philippine Stock Exchange (PSE)
- Abu Dhabi Securities Exchange (ADX)
- Dubai Financial Market (DFM)
- Bolsa de Valores de Colombia (BVC)
- Taipei Exchange (TPEX)
- Bolsa de Valores de Lima (BVL)
- The Egyptian Exchange (EGX)
- Nairobi Securities Exchange (NASE)
- Hanoi Stock Exchange (HNX)
- Ho Chi Minh Stock Exchange (HOSE)
- Prague Stock Exchange (BCPP)
- Amman Stock Exchange (AMSE)
1.3.9
Release date: August 22, 2016
Support for several additional stock exchanges and their corresponding indices:
- Borsa Istanbul (BIST)
- NASDAQ OMX Tallinn (OMXT)
- NASDAQ OMX Riga (OMXR)
- NASDAQ OMX Vilnius (OMXV)
- Qatar Stock Exchange (QSE)
- Athens Stock Exchange (ASE)
1.3.8
Release date: August 1, 2016
Support for several additional stock exchanges and their corresponding indices:
- OTC Markets (OTCMARKETS)
- OTC Bulletin Board (OTCBB)
- Vienna Stock Exchange/Wiener Boerse (VSE)
- Bolsa de Comercio de Santiago (BCS)
1.3.7
Release date: July 19, 2016
Support for several additional stock exchanges and their corresponding indices:
- New Zealand Exchange (NZX)
- Oslo Stock Exchange (OSE)
- Singapore Exchange (SGX)
- Stock Exchange of Thailand (SET)
- Bolsa de Comercio de Buenos Aires (BCBA)
1.3.6
Release date: July 7, 2016
- Support for Nigerian Stock Exchange (NGSE)
1.3.5
Release date: July 5, 2016
- Support for Bursa Malaysia Stock Exchange (KLSE)
1.3.4
Release date: June 28, 2016
- Support for Tel Aviv Stock Exchange (TASE).
1.3.3
Release date: June 16, 2016
1.3.2
Release date: June 6, 2016
New Features:
- Additional languages and cultures have been added: Japanese, Korean and Russian. Contact us if you don’t see your language/culture available.
Bug Fixes:
- Fixes an issue with some parameters not being honored from the settings page.
1.3.1
Release date: June 1, 2016
New Features:
-
Availability to display market indices in the symbol parameter, using any of the indices available at www.stockdio.com/indices.
-
Display prices as lines, candlestick, area, OHLC and HLC.
-
New parameter to specify the default prices display period, if you want other than one year.
-
Changes in the plugin activation user experience.
1.3
Release date: May 23, 2016
New Features:
- Display the chart in your native language and using the number and dates format used in your culture. This will allow your users to better understand the chart and it will integrate much better with your site or blog. Several languages and cultures are already supported, including English, Spanish, French, Italian, Portuguese, Dutch and Chinese, with more to come. Contact us if you don’t see your language/culture available.
- Indonesia Stock Exchange (IDX) is now available.
- Enhancements in labels formatting.
1.2.1
Release date: May 19, 2016
Bug Fixes:
- Fixes a bug that prevented the user from entering the app-key to activate the plugin.
1.2
Release date: May 17, 2016
New Features:
- A new allowPeriodChange parameter has been added, to allow the end user to select the display period. See documentation for details.
1.1.1
Release date: May 16, 2016
Documentation Fixes:
- Fixes an issue with the documentation, which showed a wrong name for the stock exchange parameter.
1.1
Release date: May 4, 2016
Bug Fixes:
- Fixes a bug that caused a failure when trying to display stocks from exchanges other than the default NYSE/Nasdaq.
1.0
