
Animated pie chart for comparable data graphical representation
| Author: | Aleksandar Milivojevic (profile at wordpress.org) |
| WordPress version required: | 3.0.1 |
| WordPress version tested: | 4.7.17 |
| Plugin version: | 1.1.5 |
| Added to WordPress repository: | 01-08-2016 |
| Last updated: | 26-03-2017
Warning! This plugin has not been updated in over 2 years. It may no longer be maintained or supported and may have compatibility issues when used with more recent versions of WordPress.
|
| Rating, %: | 100 |
| Rated by: | 2 |
| Plugin URI: | http://www.gootools.net/wordpress-plugins/goo... |
| Total downloads: | 3 505 |
| Active installs: | 200+ |
 Click to start download |
|
Enhance your comparable data display with animated graphic pie chart. Styled data table included, with a lot of further styling options.
Insert anywhere in the post or page via shortcode.
How it looks like? Check here: Test Preview: Animated Pie Chart – How to use and examples
Adventages
- easy to use – supply shortcode with minimum two data pairs and you are ready to go
- responsive design – graph will fit any screen size automatically
- mobile friendly – it will look nice on mobile devices
- customizable – lots of options to make your graph outlook unique
- theme friendly – tested on various WordPress themes (but we strongly recommend you to test plugin in your own theme)
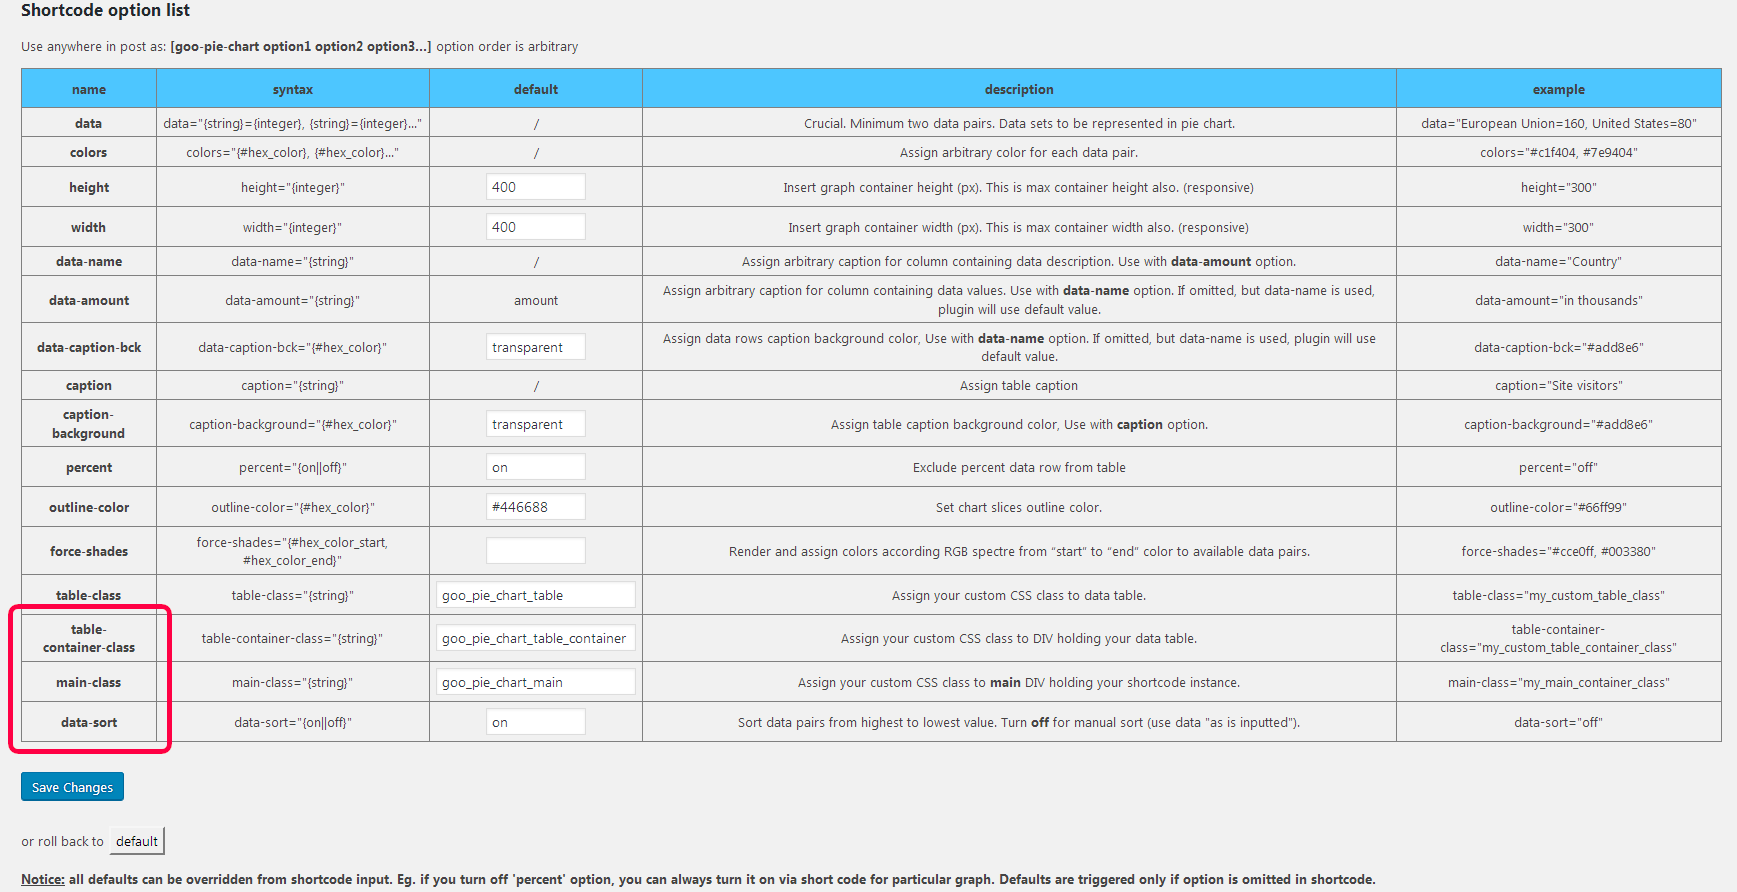
Complete list of shortcode options at official plugin page: Goo Pie Chart
Screenshots
FAQ


ChangeLog