DebugPress is an easy to use plugin implementing popup for debugging and profiling currently loaded…
| Author: | Milan Petrovic (profile at wordpress.org) |
| WordPress version required: | 5.5 |
| WordPress version tested: | 6.4.2 |
| Plugin version: | 3.7.0.1 |
| Added to WordPress repository: | 17-09-2020 |
| Last updated: | 24-01-2024 |
| Rating, %: | 100 |
| Rated by: | 4 |
| Plugin URI: | https://debug.press/ |
| Total downloads: | 8 560 |
| Active installs: | 90+ |
 Click to start download |
|
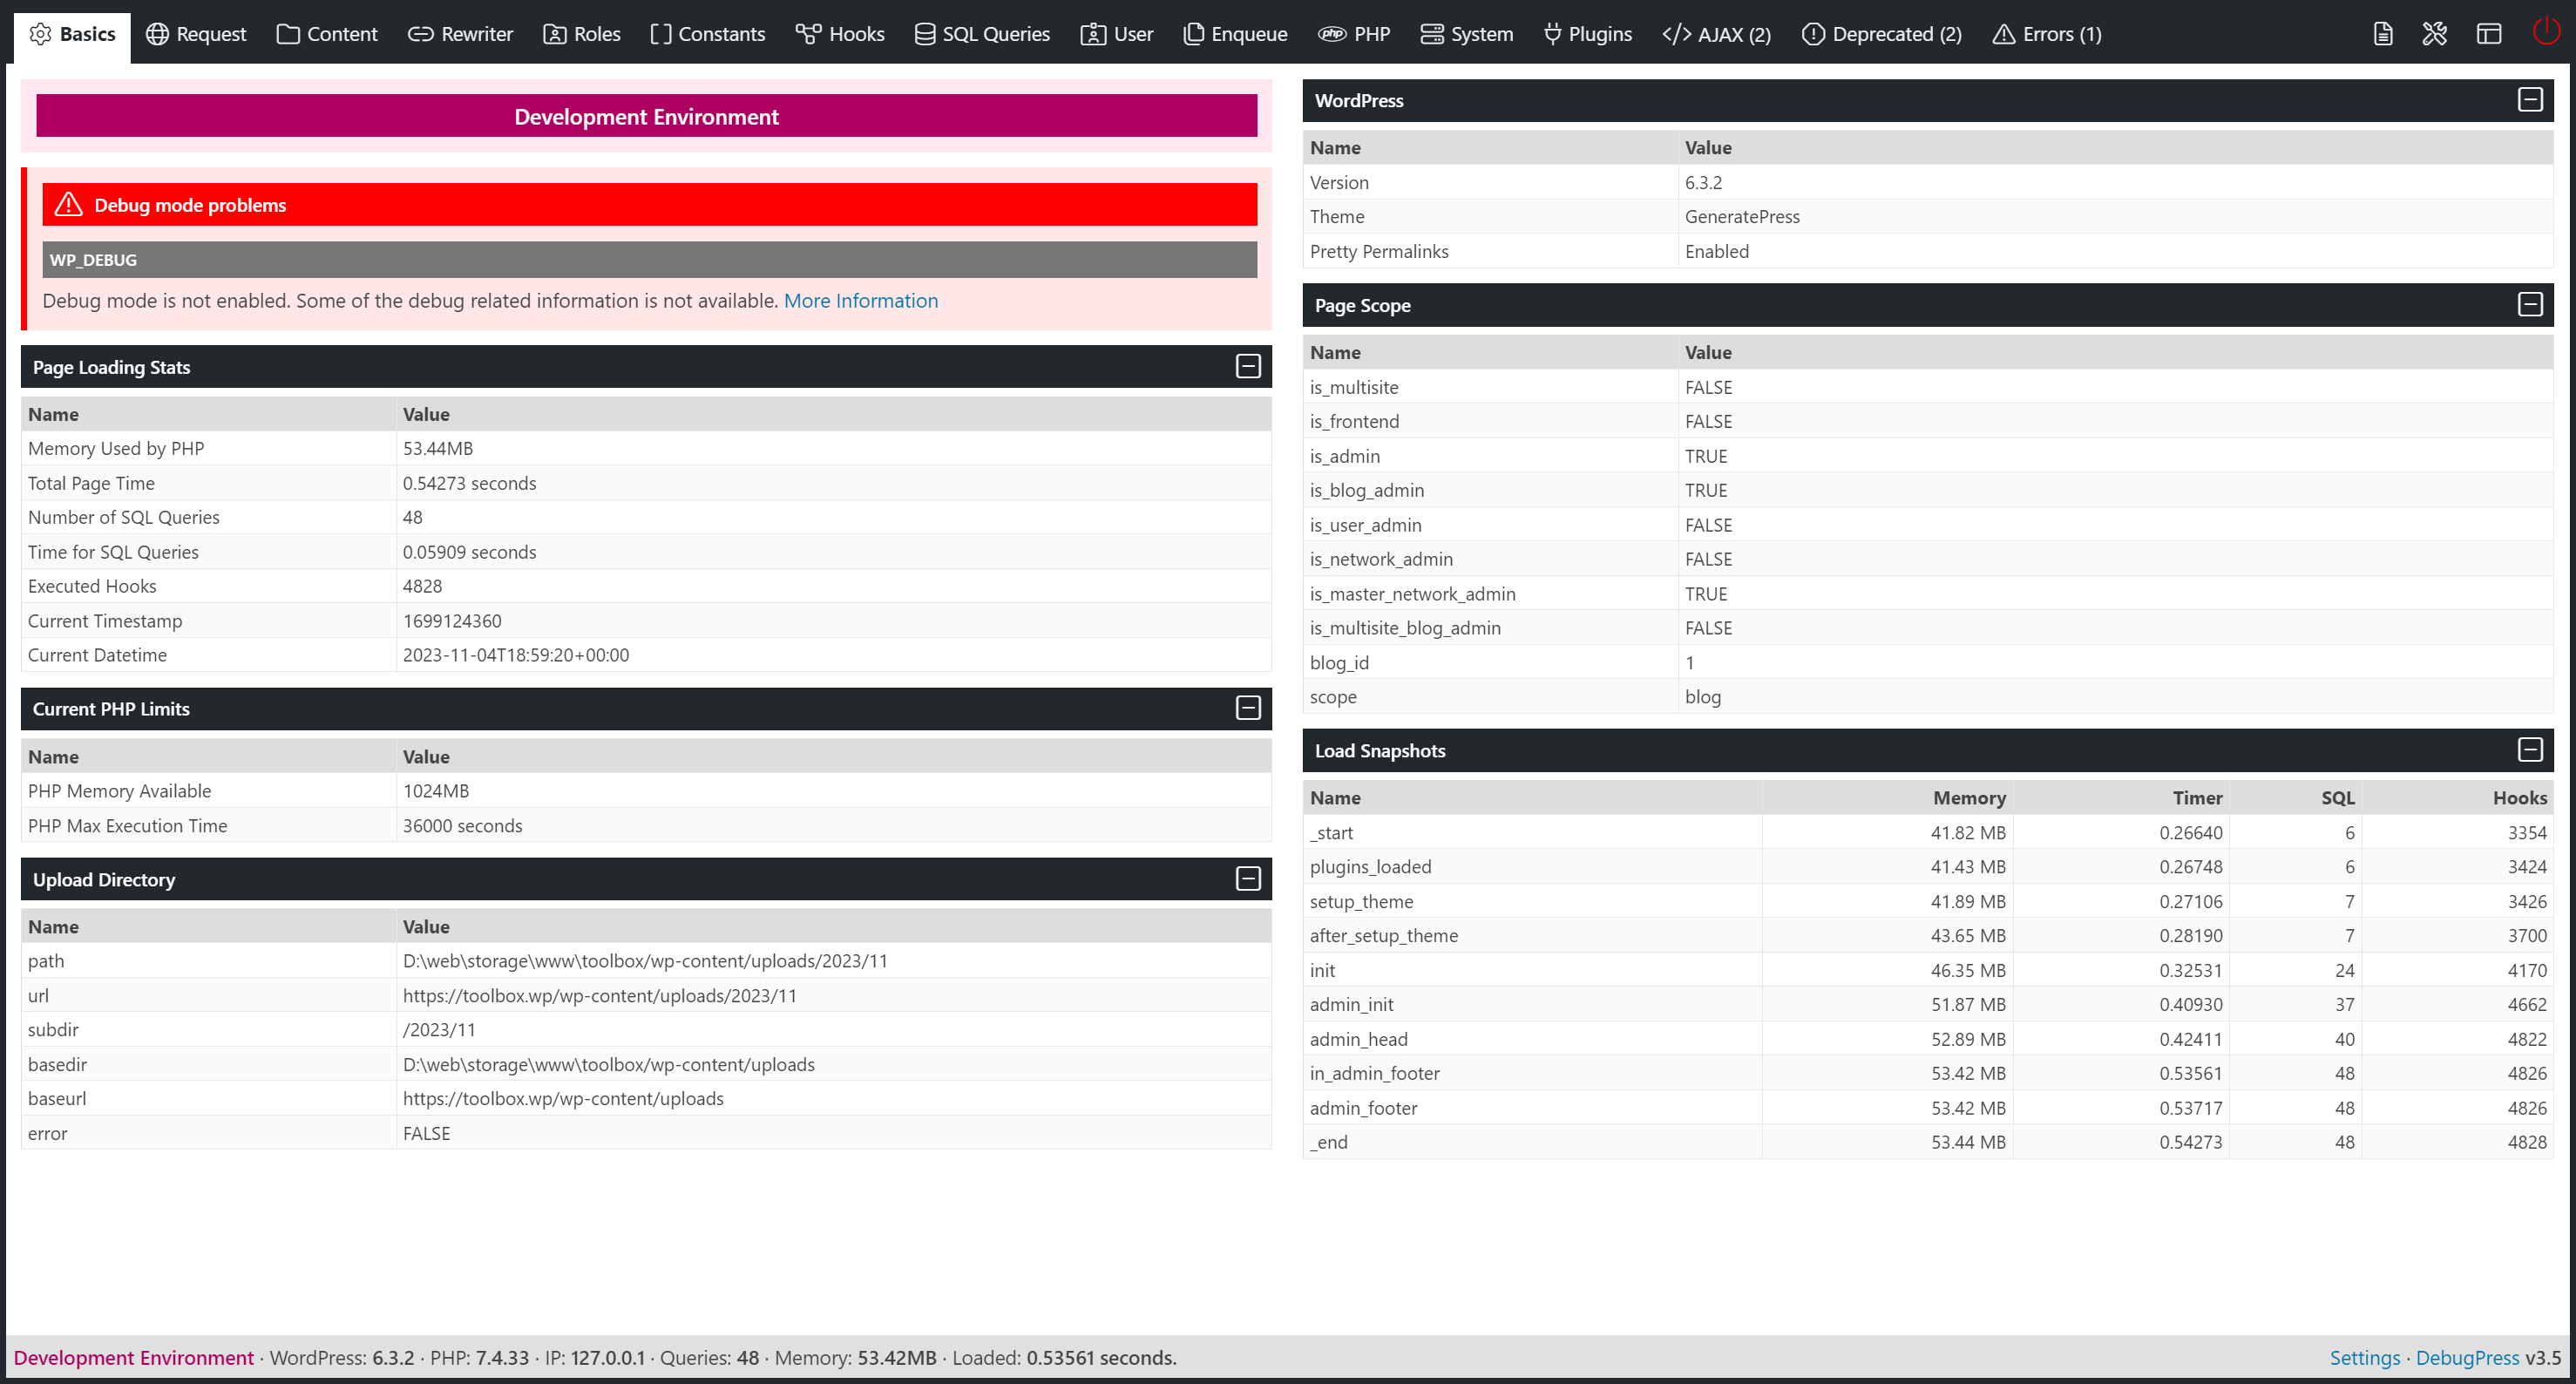
DebugPress is an easy-to-use plugin implementing popup for debugging and profiling currently loaded WordPress powered website page with support for intercepting AJAX requests. The main debugger window is displayed as a popup, activated through the button with the Bug integrated into WordPress Toolbar, or floating on the page.
The plugin currently has a total of 22 tabs in the popup debugger window, showing all kinds of information relevant to the current page, WordPress setup, background AJAX calls, and much more.
The plugin doesn’t modify or replace any WordPress files or functions.
Home and GitHub
- Learn more about the plugin: DebugPress Website
- Contribute to plugin development: DebugPress on GitHub
Quick Overview Video
Pretty Print for objects
To display the content of objects or arrays, plugin has pretty print functionality through use of simpler PrettyPrint library, or more robust third-party library Kint. You can choose one or the other from the plugin Settings, Advanced tab.
Debugger Panels
Currently, the plugin has the following panels:
- Basic
- Request (optional)
- Query (for frontend only)
- Content (optional)
- Roles (optional)
- Constants (optional)
- Hooks (optional)
- PHP (optional)
- Server (optional)
- Enqueue (optional)
- SQL Queries (if SQL queries logging is enabled)
- User (optional, if user is logged in only)
- HTTP (optional, if HTTP API calls are captured)
- bbPress (optional, on bbPress forum pages only)
- Plugins (optional, if plugins store data)
- Errors (for all captured PHP errors)
- Doing It Wrong (for captured WordPress Doing It Wrong warnings)
- Deprecated (for captured PHP deprecated warnings)
- AJAX (for captured AJAX calls while page is active)
- Store (for any user stored objects during the page loading)
- Tools (internal and external tools links)
- Debug Log (load content on demand from WordPress ‘debug.log’)
- Layout (control the size, position and activation of the popup)
SQL Queries
This panel lists all the queries WordPress has run, and it allows you to order the queries by execution order or length of execution, and all queries can be filtered by the query type, database table it targets or the WordPress function that called it. Every query displays the execution time, order, caller functions stack and fully formatted SQL query that is easy to read. For some Dev4Press created plugins (and that list will grow), DebugPress can detect the source of the query and allow you to filter by the plugin calling the query.
PHP and WordPress Errors
Plugin has 3 panels dedicated to showing PHP and WordPress errors and warnings. The Plugin captures this information during the page load, and it shows full debug trace as returned by the PHP debug tracing function.
AJAX
The plugin tracks every AJAX call coming through WordPress admin-ajax.php handler, and with every response, it returns HTTP headers with AJAX request basic execution information. Right now, plugin is not returning list of logged errors or SQL queries, because both can produce huge output that goes over the HTTP header limits. Plan is to introduce these in the future plugin versions.
Info Panels
In the administration Tools menu, plugin adds DebugPress Info page showing several panels
- PHP Info: full formatted results from
phpinfo()function - OPCache Info: full settings and statistics for the OPCache PHP extension
- MySQL Variables: full MySQL settings retrieved from the database
Plugin Settings
The plugin has various options controlling the plugin activation, button integration position, user roles that can see the debugger window, options to attempt overriding WordPress debug flags and options controlling the visibility of optional debugger panels.
Log into Database
Debugger popup is visible for the request running in the browser. But, there are many requests that are happening in the background (AJAX calls, REST API calls…), and for them, you can’t see errors, call information and other stuff in the debugger. Because of that, DebugPress supports logging of various events into database with the use of ‘coreActivity’ plugin, and it is highly recommended to install and use coreActivity.
Log various debug events into database with the free plugin: coreActivity Plugin, supporting over 120 events and 10 popular WordPress plugins. DebugPress related events will be logged and available for later analysis and this includes errors, AJAX calls and HTTP API calls.
Documentation and Support
To get help with the plugin, you can use WordPress.org support forums, or you can use Dev4Press.com support forums.
- Plugin Documentation: DebugPress Website
- Support Forum: Dev4Press Support
Screenshots
FAQ


ChangeLog